Product areas allow you to label and group similar areas of your product for filtering and color-coding in data visualizations throughout Pendo. This helps you quickly look at behavior analytics and guidance for the parts of the product you're responsible for.
You can organize many items in Pendo by product area, including Pages, Features, Track Events, guides, ideas, and feedback requests. Product areas are applied subscription-wide. Any changes to the elements in the product area impact everyone in the subscription. Each Pendo user has their own filters to show or hide product areas throughout Pendo as needed.
Use cases
Product areas enhance team collaboration by allowing team members to filter and focus on relevant data for different parts of an application (for example, Onboarding, Settings, In-app purchases, and so on). This method of organization can help improve data-driven decision-making, allowing teams to quickly navigate and analyze behavior analytics for their respective areas.
They also improve feature adoption analysis. By assigning Features to product areas, product managers can visualize and compare feature usage and adoption rates. This can help you identify which parts of your application need enhancements or additional user guidance.
Additionally, product areas can help streamline feedback management. Organizing feedback and requests into product areas allows teams to quickly filter and review user input related to specific parts of the product. This ensures that critical issues and popular feature requests are addressed promptly by those responsible for those areas of the product.
For idea portals, admins can choose which product areas visitors see in the Product areas filter and on idea and feedback cards. In Edit entity names, use the Show in portal column on the Product Areas tab. An empty include list shows all product areas; otherwise, only selected product areas are shown.
You can select one or more product areas directly as an activity source in Data Explorer. This lets you measure unique visitors or accounts across a product area and isolate Page views, Guide views, Feature clicks, or Track Events associated with it. Product areas must be kept in their own event group rather than mixed with apps or individual events. You can also include product-area event groups in supported formulas. For more information about building a report, see Build a Data Explorer report. For more information about formulas, see Formula use cases.
Requirements
- Subscription admins and users with permission to manage product areas can create, edit, and delete product areas.
- All users, except read-only, can reassign product areas.
- All users can filter by product areas.
Create product areas
You can create a product area on the Product areas page or from the Product areas filter dropdown across Pendo.
- Go to Product > Product areas in Pendo, then select + Create product area in the top-right corner of the page.
Alternatively, you can select + Create product area at the bottom of the Product areas dropdown menu if you're on a page that can filter by product areas.
- Enter a Name, then select one of the 16 available colors to represent this product area. If you don't select a color, the selection defaults to bright pink.
- Select Create to save the new product area. You can now assign various Pendo items to your new product area, including Pages, Features, Track Events, guides, ideas, and feedback requests.
View and manage product areas
To view your product area analytics, go to Product > Product areas in the left-side menu.
Add product area context
The Context column is available for every product area. Select Add context, or edit existing context, to describe the Product Area's scope, functionality, common user terms, and overlap with other areas. Then select Save changes. Pendo uses this context to improve AI-powered features such as automatic Product Area assignment in Listen. For guidance, see Automatically assign feedback to Product Areas using AI.
Review overview metrics
The Overview metrics section summarizes engagement for the current application, product area, date range, segment, and metadata filters. If you haven't selected a product area, the metrics cover activity in the selected applications. If you select one or more product areas, the metrics include interactions with the Pages, Features, and Track Events assigned to any of those product areas.
Select Manage metrics to add, remove, or reorder metrics. Select a metric tile to view its trend over time. Each tile shows the value for the selected date range and, when data is available, the change from the previous period.
You can add the overview metrics grid or the trending chart to a dashboard as a widget. The widgets are named Product Areas overview metrics and Product Areas overview chart by default. The chart widget preserves the selected metric, Product Area scope, filters, breakdown, granularity, display type, and result limit.
For these metrics, active means that a visitor or account generated at least one interaction in the current scope. Available metrics include:
- Visitors. The number of unique visitors who interacted in the current scope during the selected date range.
- New visitors. The number of visitors who interacted in the current scope for the first time during the selected date range.
- Average time. The average length of time visitors spend on the tagged Pages in a product area, calculated as total page time divided by the number of visitors. Because it's based on tagged Page events, time on untagged pages isn't included. For how Pendo measures time, see Time on page and app calculations.
- Visitor retention. The percentage of visitors who were active in an earlier period and returned to interact again in a later period.
- New visitor retention. The percentage of first-time visitors from an earlier period who returned to interact again in a later period.
- Visitor stickiness. The proportion of active visitors who return frequently, shown as a ratio you choose: DAU/MAU, DAU/WAU, or WAU/MAU. You can include or exclude weekends from the calculation.
- Accounts. The number of unique accounts with visitor activity in the current scope during the selected date range.
- New accounts. The number of accounts with their first visitor activity in the current scope during the selected date range.
- Account retention. The percentage of accounts with activity in an earlier period that had activity again in a later period.
- Account stickiness. The proportion of active accounts that return frequently, shown as a ratio you choose: DAA/MAA, DAA/WAA, or WAA/MAA. You can include or exclude weekends from the calculation.
Account and stickiness metrics appear only when they're available for your subscription. Stickiness uses the same calculation as the Stickiness Metric widget. For details, see Measure stickiness. For how retention cohorts are calculated, see Retention.
This page displays analytics linked to each product area, including the total number of Pages, Features, Track Events, and apps associated with each product area, as well as trending visitor and account counts (for product areas that contain at least one Page, Feature, or Track Event). Use the Show trends option above the table to show or hide previous-period trend indicators. Pendo saves this preference for your user. When table comparison is available, visitor and account metrics can also be compared by segment or metadata, with comparison values shown as child rows beneath each product area.
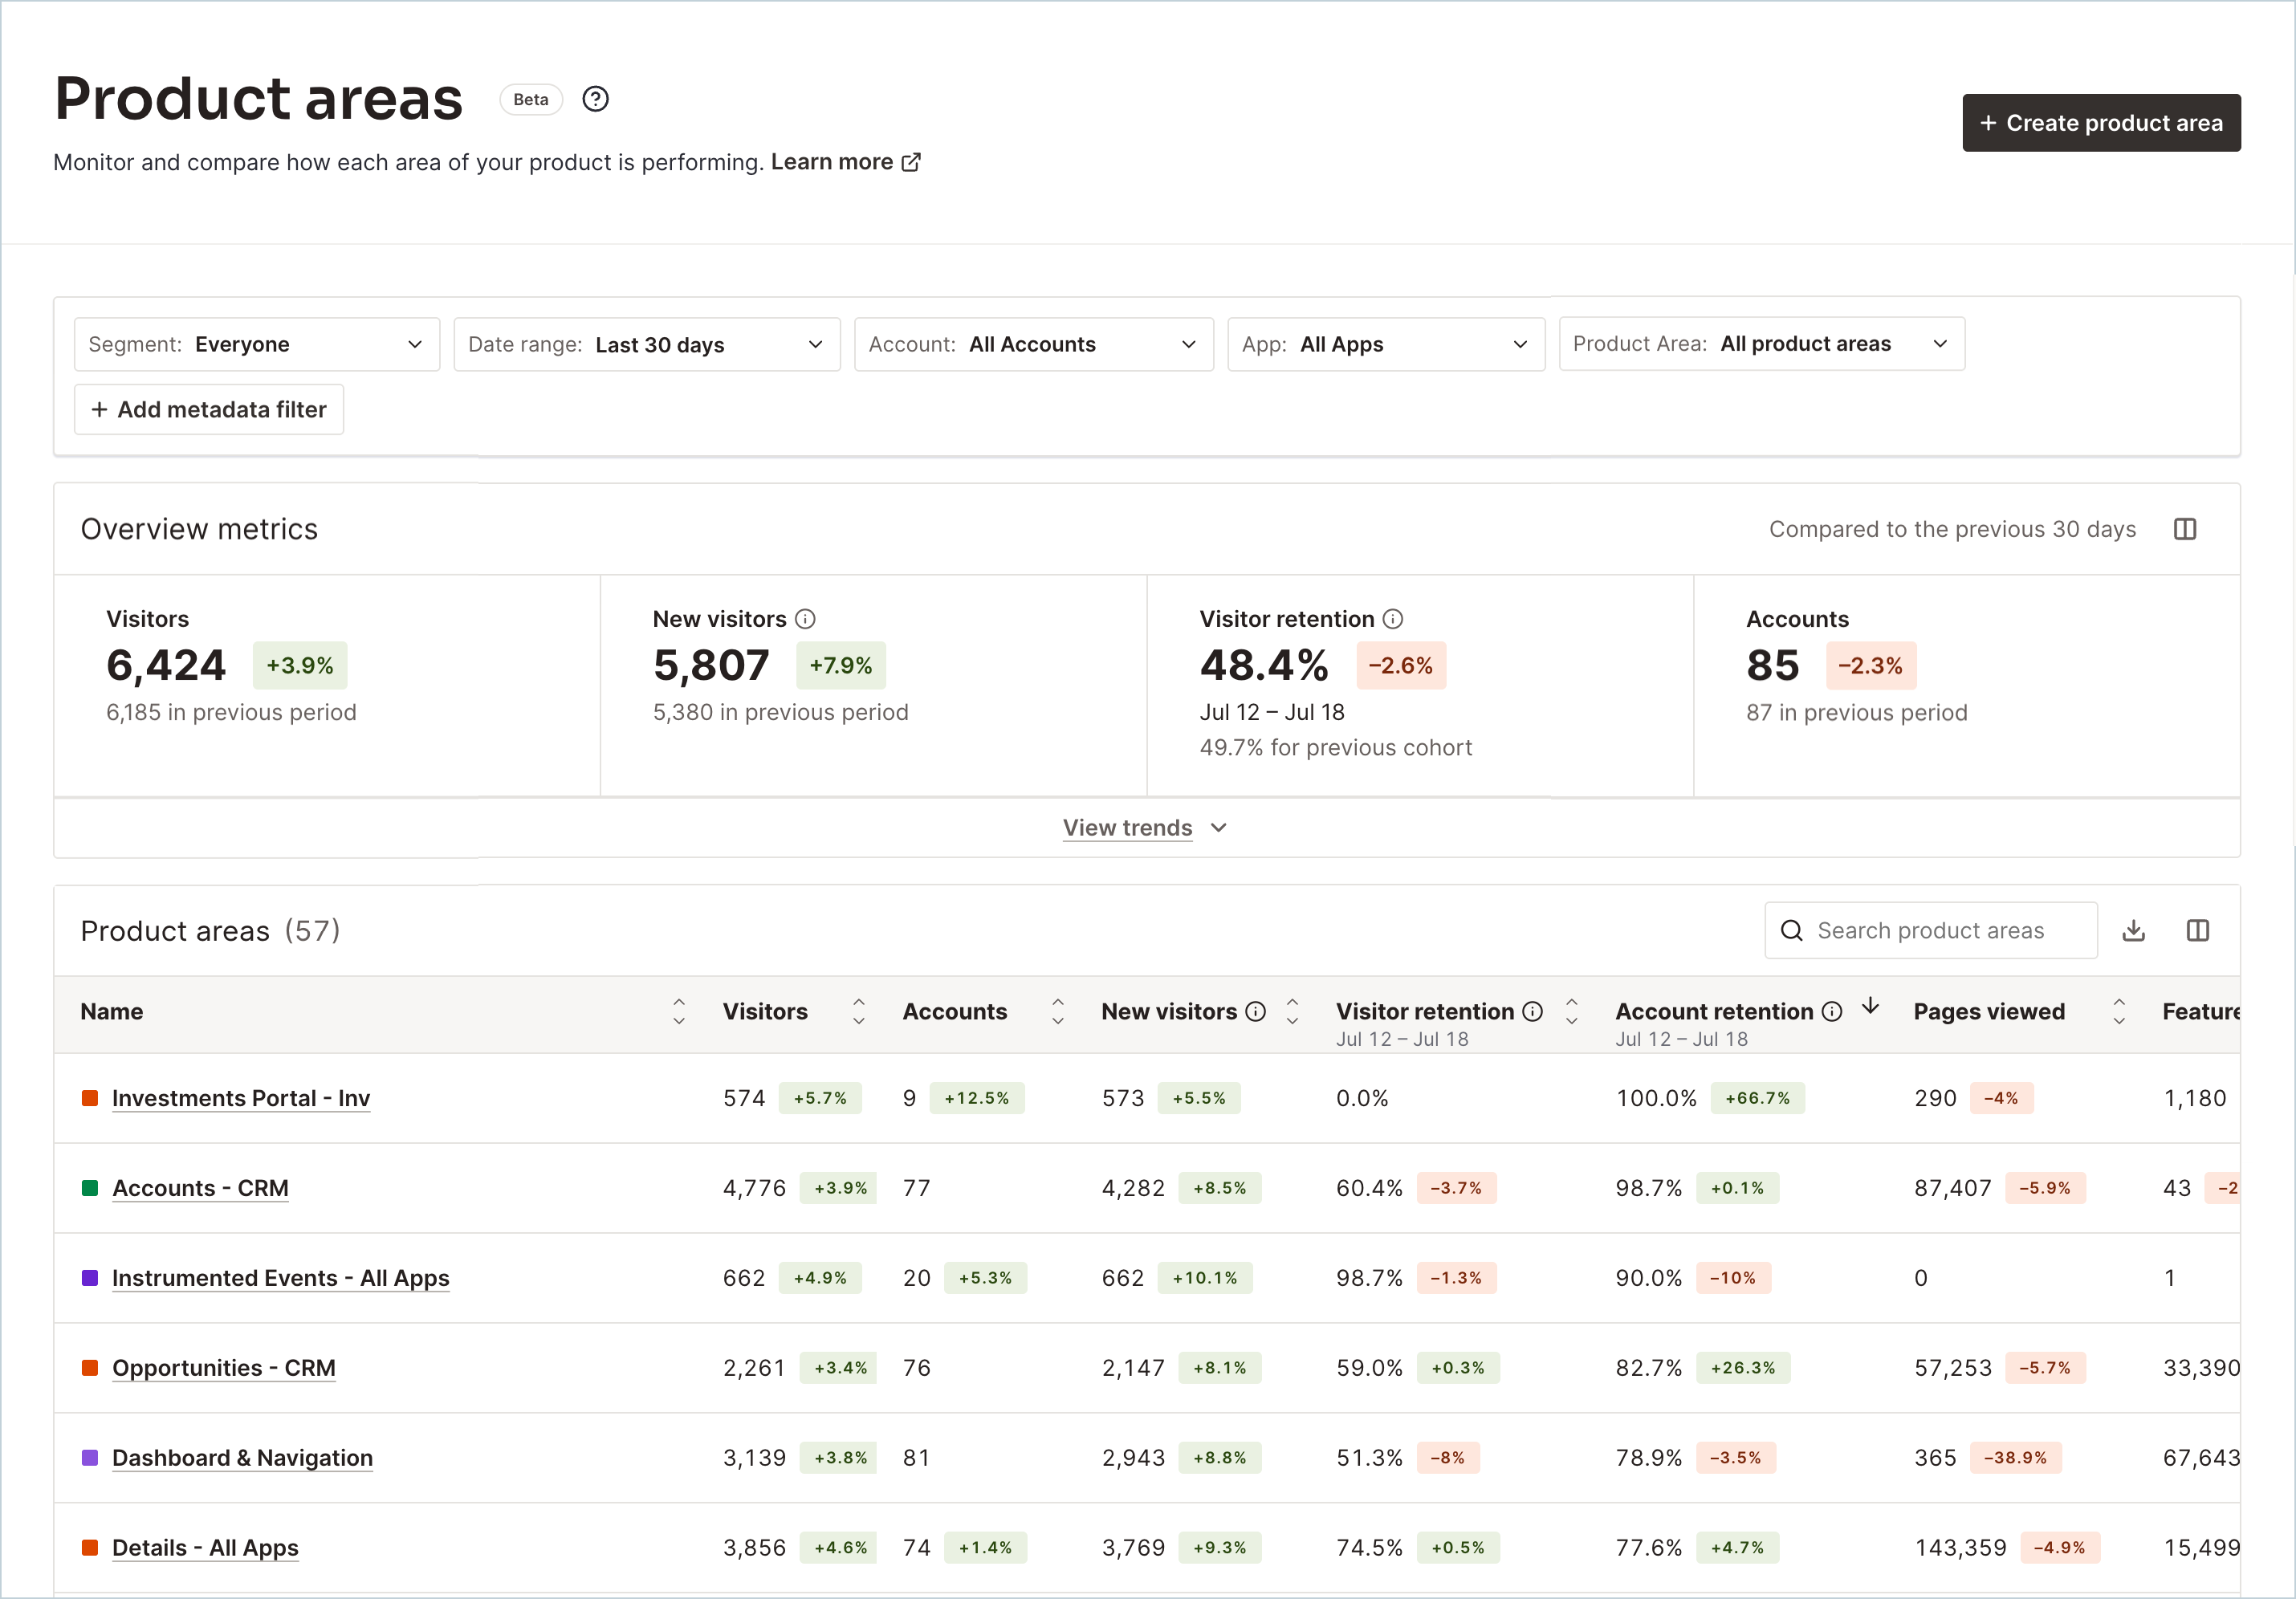
Note: You can also adjust and add columns for your preferred view and download the table to a CSV file using the respective icons in the top-right corner of the table. When a comparison is applied, the CSV includes a compare-by column. Parent rows are labeled Everyone for segment comparisons or All for metadata comparisons, while comparison child rows show the segment name or metadata value. Non-metric columns display -- for comparison child rows.
Stickiness columns
The product areas list includes a Visitor stickiness column, which shows by default, and an Account stickiness column, available through the column chooser when accounts are turned on for your subscription.
For each product area, stickiness is calculated across all tagged Pages, Features, and Track Events in that area. This lets you assess habit-forming usage at the module level, not just across your entire app.
To change the ratio shown in a stickiness column:
- Go to Product > Product areas.
- Select one of the stickiness column headers.
- Choose your preferred ratio: DAU/MAU, DAU/WAU, or WAU/MAU for visitor stickiness, or the account equivalent for account stickiness.
Your ratio preference for product areas is saved separately from your app health preference. Stickiness columns respect page-level filters, including date range and segment, and are sortable.
Note: Retention and stickiness metrics can't be calculated for anonymous-only visitor segments and show -- in those cases.
View trends
Select any metric, or select View trends below the metrics, to open a trending chart that shows how it changes over time.
To keep the current chart on a dashboard, select the Add to Dashboard icon in the chart header. The resulting Product Areas overview chart widget preserves the selected metric, Product Area breakdown, granularity, display type, Show top limit, and current filters.
You can hover over a data point in the chart for more details. To adjust the view, use these dropdowns:
- Use Breakdown to switch between an aggregate view and By product area. The product area breakdown includes the product areas selected in the top filter bar, or all product areas if none are selected. When you break down by product area, use Show top to set how many product areas appear in the chart, up to 10. Pendo ranks product areas by the selected metric before displaying the top results, including product areas with no data as zero where applicable.
- Use Display type to switch between a line chart for trends and a bar chart for aggregate comparisons.
- Use Granularity to change the time interval shown in the chart. Granularity is available for the aggregate view, and Show top replaces it when you break down by product area.
View product area details
If you want to view the analytics for a specific product area, select a product area name to view the product area's details page. This page provides a list of all the Pages, Features, and Track Events associated with that specific product area.
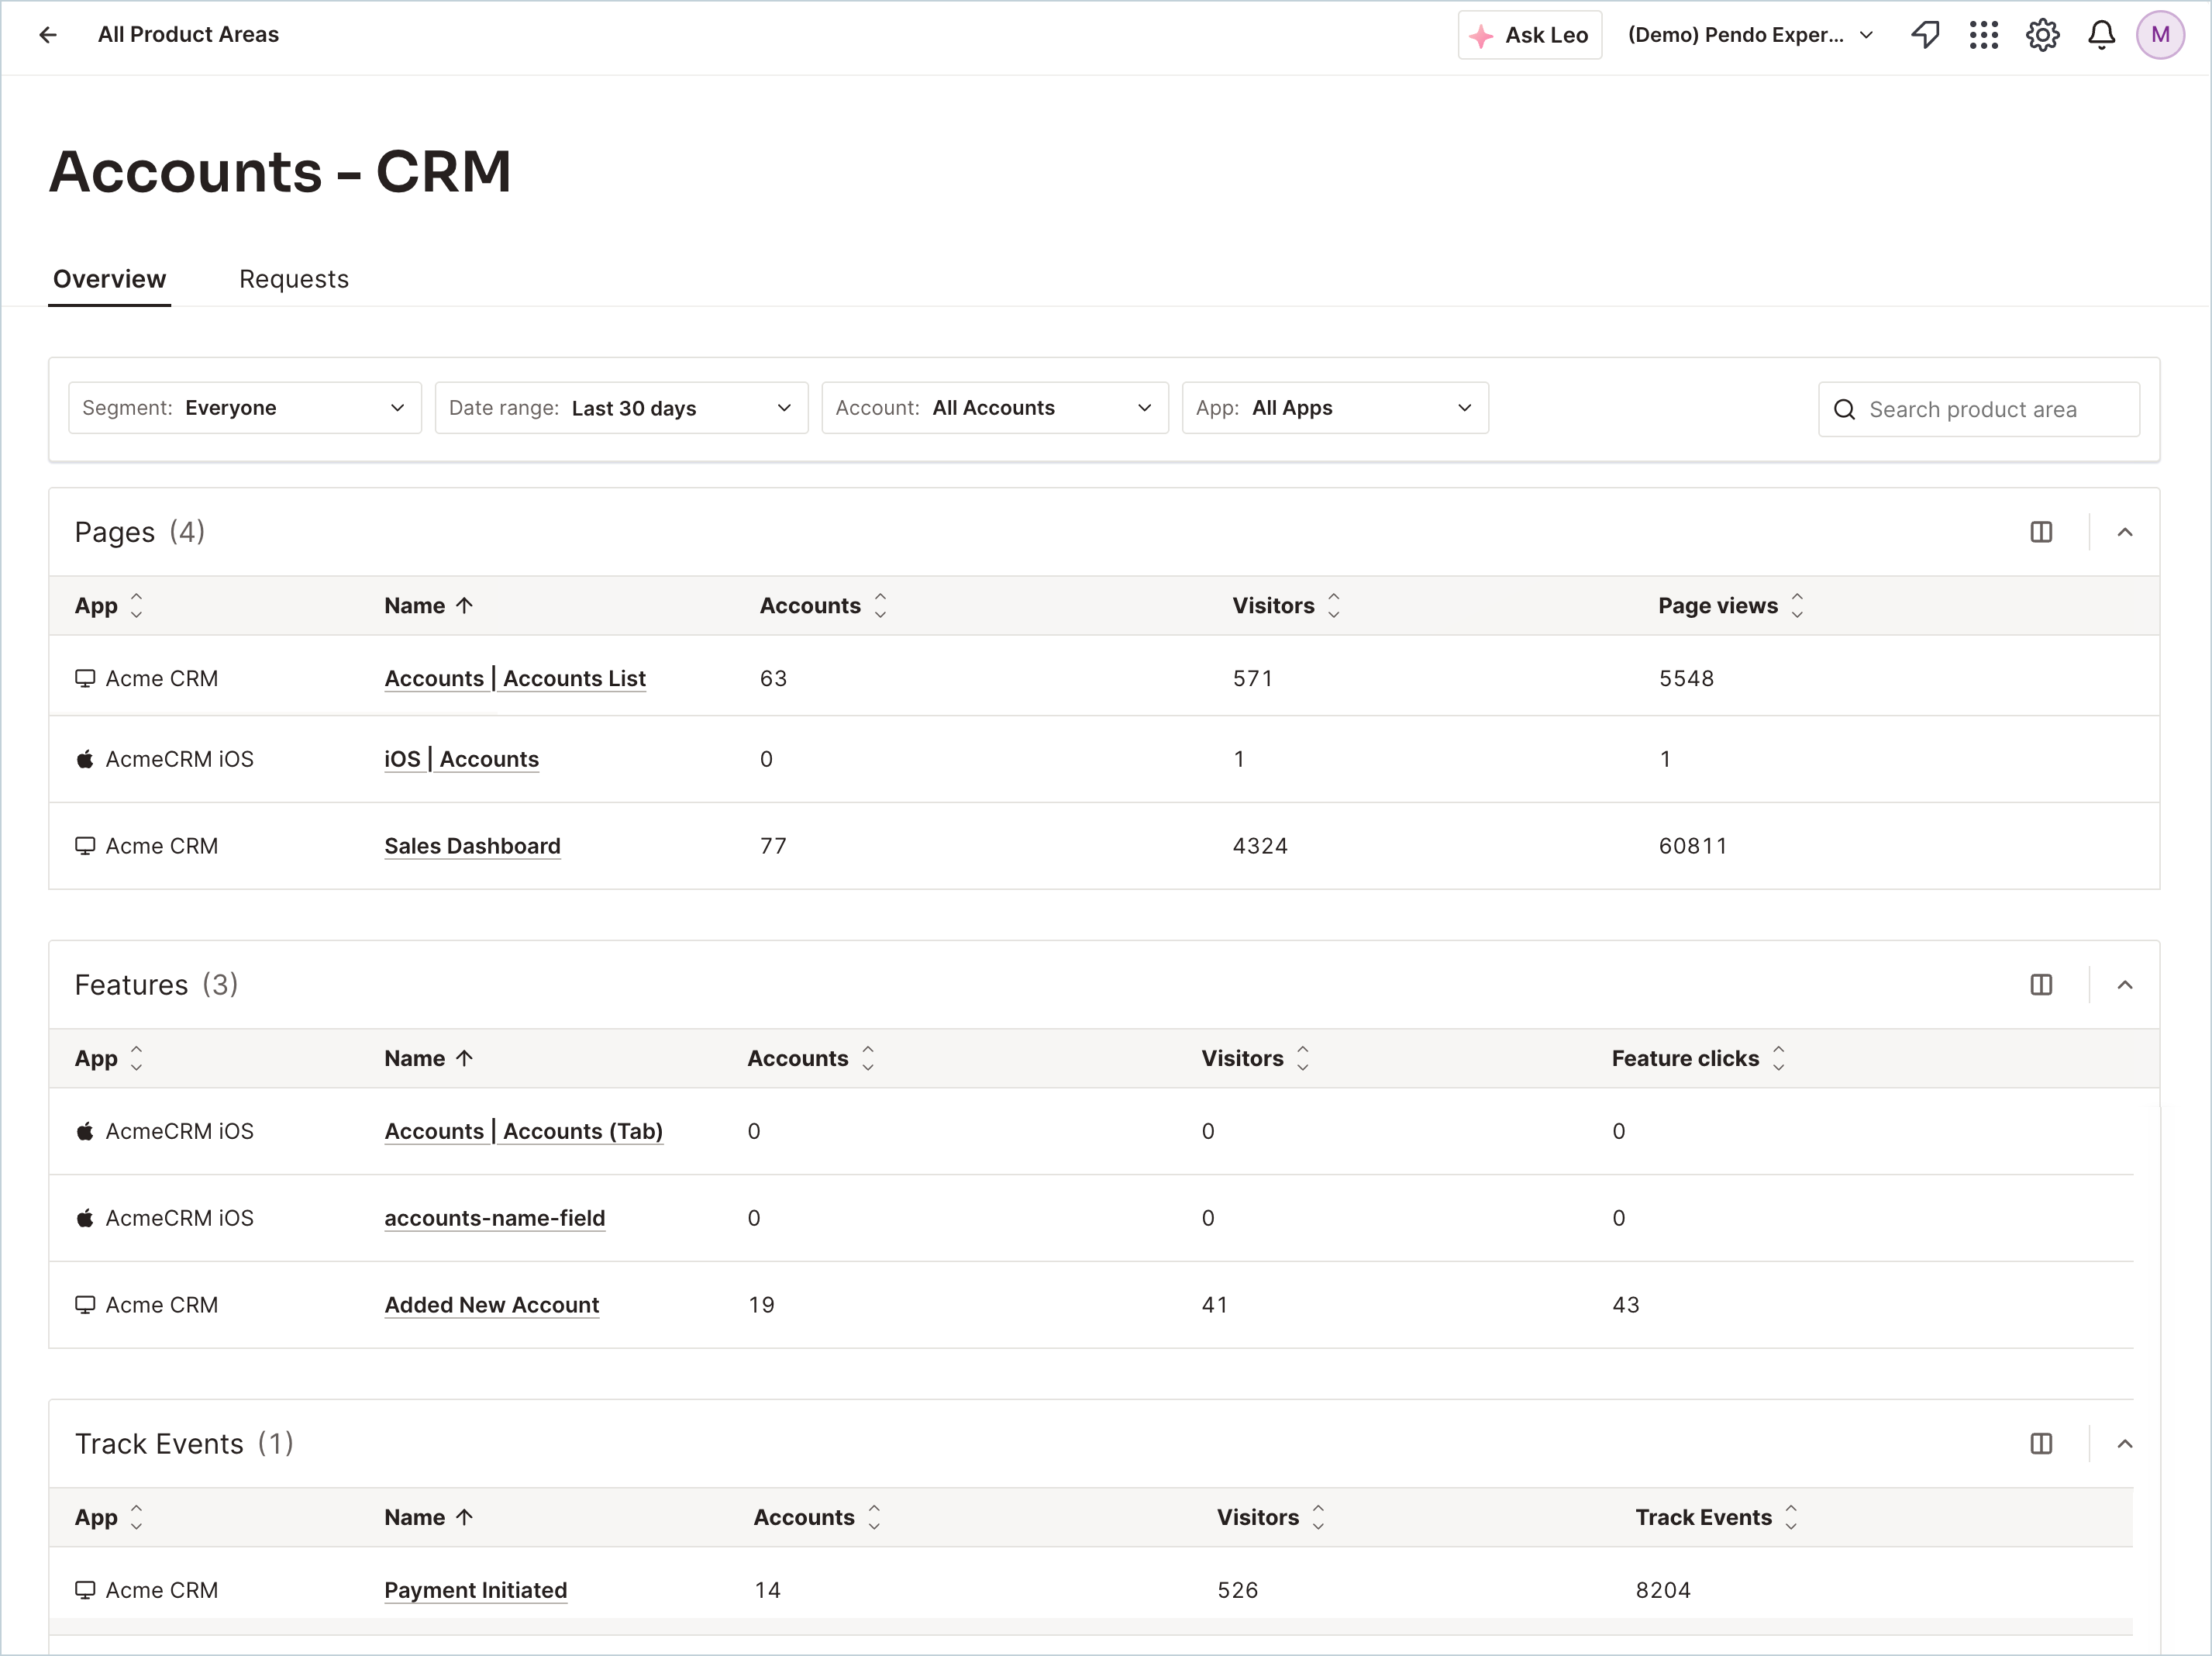
You can filter the Product areas list by app, product area, and metadata to narrow the table to the data you need. Selecting an app filters the table to only the product areas used in that app. The Product areas list and details pages use page-specific filters, so selections don't change the global filters used elsewhere in Pendo. Your Product areas list selections persist across sessions. The first time you visit, Pendo can initialize the page from your saved product-area filter, but later changes remain scoped to this page.
Filter by product area throughout Pendo
Where a global filter bar includes the Product areas filter, open the filter, select one or more product areas, and then select Apply. Your selected product areas move to the top of the list so they're easy to review and remove. To discard your changes, select Cancel, or use Select all and Clear all to add or remove every product area at once.
Pendo updates the page to include data associated with any of the selected product areas. This includes dashboards with the product area filter. On dashboards, the selection updates only widgets that support product area filtering; unsupported widgets remain unchanged.
Edit and delete product areas
After you create a product area, you can go back and adjust the settings or delete it. Editing a product area updates its name or color wherever it's applied, while deleting it removes the association from all related items without disrupting functionality.
To edit, select the Product Area dropdown on any page where you can filter by product area and select the edit (pencil) icon. Make your desired changes, then select Save changes. You can also edit the product area name directly by selecting the name in the header of the product area's details page.
Tip: You can use product areas in conjunction with favorites. For example, you can see only the favorited items from only product area A by selecting the star icon in the top filters and selecting Product Area A from the Product Areas dropdown menu.
To delete one product area, select the delete (trash) icon in the top-right corner and confirm the deletion.
To delete multiple product areas from the Product areas table, select the checkbox next to each product area, then select Delete in the table header. In the confirmation window, clear the checkbox for any product area you want to keep, then confirm the deletion.
Deleting a product area removes its assignment from associated Pendo items. It doesn't delete the Pages, Features, Track Events, guides, feedback, ideas, or other items that were assigned to it.